DashboardLLM
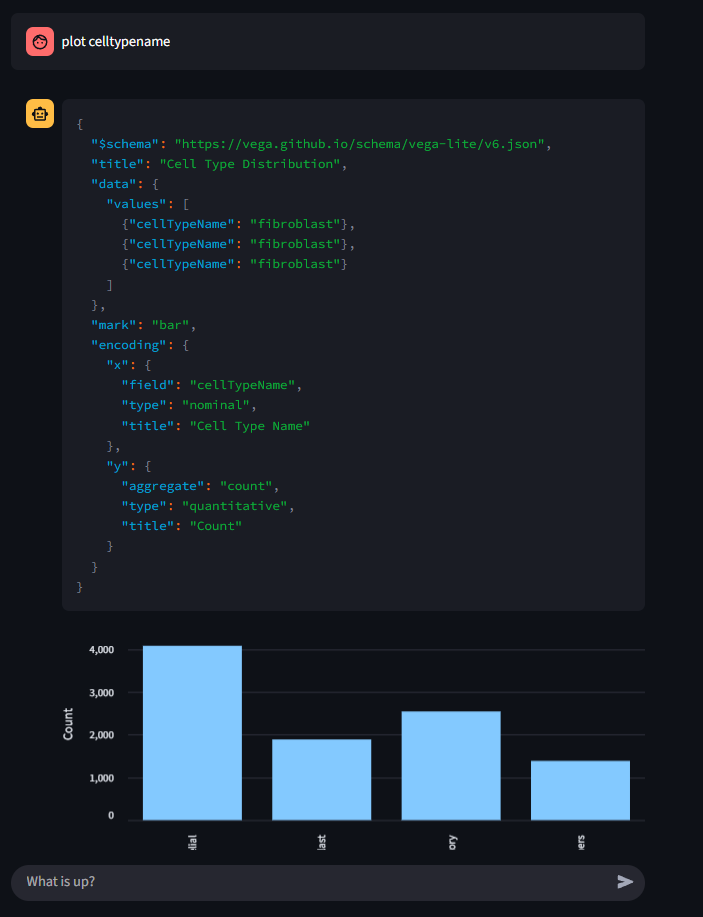
It generates charts based on the data using Vega-Lite JSON specifications, ensuring safe and efficient visualization without any malicious code execution.
Key Features
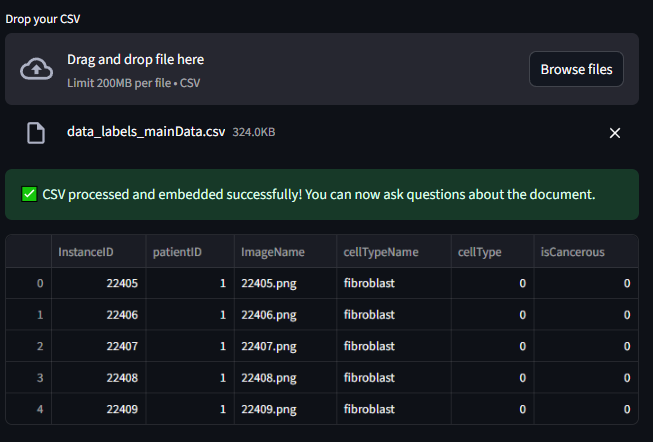
- CSV Processing: Reads and processes data from uploaded CSV files to generate insights.
- Chart Generation: Creates interactive charts using Vega-Lite JSON specifications, ensuring secure and reliable visualization.
- Retrieval-Augmented Generation (RAG): Employs a vector database (ChromaDB) to find the most relevant data chunks to answer user queries.
- Local LLMs: Powered by local language models via Ollama, ensuring privacy and control over the models used.
Tech Stack
- Backend & Orchestration: Python, LangChain
- Frontend: Streamlit
- LLM Serving: Ollama
- Models:
- Generation:
Qwen(or any other powerful chat model) - Embeddings:
granite-embedding:latest
- Generation:
- Vector Database: ChromaDB
- CSV Processing: Pandas
How It Works
- CSV Upload: Users upload a CSV file containing structured data.
- Context Retrieval: Relevant data chunks are retrieved using ChromaDB.
- Chart Generation: The system generates Vega-Lite JSON specifications based on the data and renders interactive charts.
- Interactive Chat Interface: Users interact with the chatbot via a Streamlit-based UI.
Getting Started
- Clone the repository:
git clone https://github.com/Ajeets6/dashboard-LLM.git
cd dashboard-LLM- Install dependencies:
pip install -r requirements.txt- Run the application:
streamlit run main.py- Upload a CSV file and start interacting with the chatbot.
Security
DashboardLLM ensures safe operation by: - Using Vega-Lite JSON specifications for chart generation, eliminating the risk of malicious code execution. - Employing local language models for privacy and control.
Source: dashboard-LLM